Calendar year 2020
Introduction
This report describes the quality of Lake of the Woods Community Club drinking water during 2020. It complies with federal and state laws that require water utilities to provide water quality information to customers every year. It is referred to as the Consumer Confidence Report. This report is a snapshot of the quality of the water that was provided last year. Information is included about where your water comes from, what it contains, and how it compares to Environmental Protection Agency (EPA) and state standards.
Water System Information
This community’s water comes from an aquifer or underground source of water. Groundwater wells bring the water to the surface. There are four wells, commonly called Well 1, 2, 3 and 4. (The Office of Drinking Water numbers are S01, S02, S03 and S04.) The wells are located near Pete Rix Park, Dorothy McGowan Park and off 137th Street. Lake of the Woods Community Club owns the land around these wells and restricts activity that could contaminate them. The susceptibility of the wells in this system to contamination is moderate to low. After the water comes out of the wells, it is distributed through a system of pipes to homes in the community. The water is not treated. However, chlorine is occasionally added to the system on a one-time basis.
The Lake of the Woods Water System is a public water system. The system’s state identification number is 44387E. To get more information about the water system, contact Tony Trotter at (253) 884-4703, and/or attend a Lake of the Woods Community Club board meeting. Meetings are currently held at 7:00 PM on the second Monday of the month at Dorothy McGowan Park. Notice of any change in meeting times or places will be posted at all three Lake of the Woods Community Club entrances. The Lake of the Woods Community Club contact number is: (253) 884-9256. EPA’s hotline number is 1-800-426-4791.
Water Quality Data
The tables below list all the drinking water contaminants that were detected during the 2020 calendar year. The presence of these contaminants in the water does not necessarily indicate that the water poses a health risk. Unless otherwise noted, the data presented in these tables is from testing done January 1-December 31, 2020. The State requires testing for some contaminants less than once per year because the concentrations of these contaminants are not expected to vary significantly from year to year.
Terms & abbreviations used below:
• Maximum Contaminant Level Goal (MCLG): the level of a contaminant in drinking water below which there is no known or expected risk to health. MCLGs allow for a margin of safety.
• Maximum Contaminant Level (MCL): the highest level of a contaminant that is allowed in drinking water. MCLs are set as close to the MCLGs as feasible using the best available treatment technology.
• Action Level (AL): the concentration of a contaminant which, when exceeded, triggers treatment or other requirements which a water system must follow.
• State Reporting Level (SRL): The level below which reporting is not required
• Lead and Copper 90th percentile: Out of every 10 homes sampled, 9 were at or below this level.
• n/a: not applicable
• nd: not detectable at testing limit
• ppb: parts per billion or micrograms per liter
• ppm: parts per million or milligrams per liter
• pCi/l: picocuries per liter (a measure of radiation)
EPA Regulated
| Inorganic Contaminants (units) | MCL | MCLG | Highest Detected Level | Range of Detections | Violation | Typical Source of Contaminant |
| Nitrate as Nitrogen( ppm) | 10 | 10 | 1.96 | 0.56-1.96 | No | Runoff from fertilizer use |
EPA Regulated (Secondary) Note: These are results from testing done in 2017
| Inorganic Contaminants (units) | MCL | MCLG | Highest Detected Level | Range of Detections | Violation | Typical Source of Contaminant |
| Chloride( ppm) | 250 | 250 | 4 | 2-4 | No | Erosion of natural deposits |
| Sulfate (ppm) | 250 | 250 | 4 | 2-4 | No | Erosion of natural deposits |
State Regulated Note: These are results from testing done in 2017
| Inorganic Contaminants (units) | MCL | SRL | Highest Detected Level | Range of Detections | Violation | Typical Source of Contaminant |
| Sodium (ppm) | NA | 5 | 5 | <5-5 | NA | Naturally occurring |
| Hardness (ppm) | NA | 10 | 66 | 47 – 66 | NA | A quality of water containing dissolved components of calcium and manganese. |
| Conductivity(umhos/cm) | 700 | 10 | 155 | 102 – 155 | No | NA |
| Turbidity (ntu) | NA | 0.1 | 0.5 | <0.1-0.5 | NA | A measure of the cloudiness of water. |
State Unregulated Note: These are results from testing done in 2017
| Inorganic Contaminants (units) | MCL | SRL | Highest Detected Level | Range of Detections | Violation | Typical Source of Contaminant |
| No lead or copper detected |
| Microbiological Contaminants | MCL | MCLG | Highest Detected Level | Range of Detections | Violation | Typical Source of Contaminant |
| Total coliform (# of monthly positive samples) | 1 | 0 | 0 | NA | No | Naturally occurring in the environment. |
Other testing:
Lead and Copper: In 2020, the water was tested for lead and copper as it comes out of the tap in 10 Lake of the Woods homes. The results from the 10 samples are compared to an Action Level (AL) to determine whether further measures by the water system are required. The Action Level for lead is 15 parts per billion (ppb) measured in the 90th percentile. The copper action level is 1.3 parts per million (ppm) measured in the 90th percentile. This water systems’ 90th percentile results were: copper = 0.308 mg/L; lead = 0.0017 mg/L (or 1.7 parts per billion). None of the 10 sampled sites exceeded the Action Level for lead or copper.Notice of the individual results was delivered to each home where a sample was taken.
Required Educational Information
Drinking water, including bottled water, may reasonably be expected to contain at least small amounts of some contaminants. The presence of contaminants does not necessarily indicate that water poses a health risk. More information about contaminants and potential health effects can be obtained by calling the EPA’s Safe Drinking Water Hotline (800-426-4791).
Some people may be more vulnerable to contaminants in drinking water than the general population. Immuno-compromised persons such as persons with cancer undergoing chemotherapy, persons who have undergone organ transplants, people with HIV/AIDS or other immune system disorders, some elderly, and infants can be particularly at risk from infections. These people should seek advice about drinking water from their health care providers. Environmental Protection Agency/Centers for Disease Control guidelines on appropriate means to lessen the risk of infection by Cryptosporidium and other microbial contaminants are available from the Safe Drinking Water Hotline (800-426-4791).
The sources of drinking water (both tap water and bottled water) include rivers, lakes, streams, ponds, reservoirs, springs, and wells. As water travels over the surface of the land or through the ground, it dissolves naturally-occurring minerals and, in some cases, radio-active material, and can pick up substances resulting from the presence of animals or from human activity.
Contaminants that may be present in source water include:
- Microbial contaminants, such as viruses and bacteria, which may come from sewage treatment plants, septic systems, agricultural livestock operations and wildlife.
- Inorganic contaminants, such as salts and metals, which can be naturally-occurring or result from urban storm water runoff, industrial or domestic wastewater discharges, oil and gas production, mining or farming.
- Pesticides and herbicides, which may come from a variety of sources such as agriculture and residential uses.
- Radioactive contaminants, which can occur naturally or result from oil and gas production and mining activities.
- Organic chemical contaminants, including synthetic and volatile organic chemicals, which are by-products of industrial processes and petroleum production. They can also come from gas stations, urban storm water runoff, and septic systems.
A Statement about Lead:
If present, elevated levels of lead can cause serious health problems, especially for pregnant women and young children. Lead in drinking water is primarily from materials and components associated with service lines and home plumbing. Lake of the Woods is responsible for providing high quality drinking water, but cannot control the variety of materials used in plumbing components. When your water has been sitting for several hours, you can minimize the potential for lead exposure by flushing your tap for 30 seconds to 2 minutes before using water for drinking or cooking. If you are concerned about lead in your water, you may wish to have your water tested. Information on lead in drinking water, testing methods, and steps you can take to minimize exposure is available from the Safe Drinking Water Hotline or at http://www.epa.gov/safewater/lead.
In order to ensure that tap water is safe to drink, the Department of Health and EPA prescribe regulations that limit the amount of certain contaminants in water provided by public water systems. The Food and Drug Administration (FDA) and the Washington Department of Agriculture regulations establish limits for contaminants in bottled water that must provide the same protection for public health.
Water Use Efficiency Report
Calendar year 2020
Background
This is the annual Water Use Efficiency Report to Lake of the Woods water system customers. It is an update for you on the progress made by the water system in implementing the requirements of the Water Use Efficiency Rule, commonly called WUE. The rule establishes the standard that water systems must achieve 10% or less leakage from the distribution system. To measure the loss due to leakage there must be water meters at the sources, that is, at our wells, and at the service connections to customers. Lake of the Woods has installed meters at all the wells and water production has been measured for many years. By the end of 2013 meters were also installed at all the service connections. In the course of the meter installation work, many leaks were discovered and repaired, which has increased the system’s efficiency.
Goals
The water system needs to establish measurable production goals and customer goals for reduction of water usage. Now that service meters are installed it is possible to measure customer usage.
At its December 2013 meeting, the Board adopted the following goal, which is based on well production only:
To reduce the average amount of water pumped from our source wells per customer connection by 3% over the next three years.
At its July 2019 meeting, the Board updated that goal as follows:
Reduce average amount of water pumped from our source wells by 3% over the next three years.
Water system customers are encouraged to use water efficiently and continue to help meet this goal. The goals must be updated at least every 6 years.
Progress
The amount of water pumped varies from year to year as shown in the table below. Using a 3 year average clarifies that the goal is being met on a system wide basis.
| Annual Reported Total Production from Wells, gallons | 3 Year Average, gallons | Percent Reduction, Compared to 2013 | |
| 2010 | 28,075,339 | ———- | ———- |
| 2011 | 34,964,138 | ———- | ———- |
| 2012 | 31,058,534 | ———- | ———- |
| 2013 | 24,237,696 | 30,086,789 | ———- |
| 2014 | 25,291,913 | 26,862,714 | ———- |
| 2015 | 27,068,486 | 25,532,698 | ———- |
| 2016 | 27,291,446 | 26,550,615 | 12% |
| 2017 | 27,473,801 | 27,277,911 | 9% |
| 2018 | 27,997,251 | 27,587,499 | 8% |
| 2019 | 29,799,419 | 28,423,490 | 6% |
| 2020 | 26,437,060 | 28,077,910 | 7% |
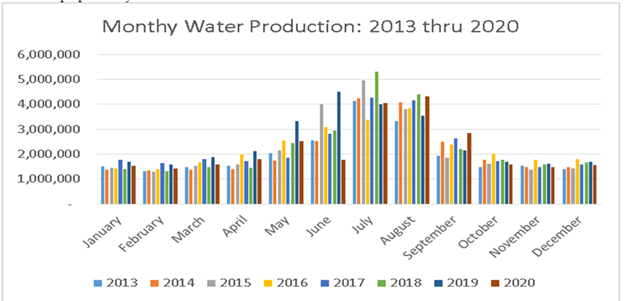
The graph below shows the monthly amounts of water produced from the wells: 2013 thru 2020. It is presented for illustration purposes only.